| You are here: Home » Import CAD Formats » PRC and 3D PDF |
|
General Overview
How Can I Reduce the Overall Number of Polygons Created by the PDB Importer?
Where Can I Find PDB and MOL Files?
Overview of the PDB - the Protein Databank
Structure of PDB Files
Bonding in PDB Files
Backbones and Ribbons
The MOL File Format
WEB Resources
Features Of this Import Converter
Limitations
Dialog Box Options
This import converter reads in ASCII files based on the PDB file format (Protein Database, see http://www.rcsb.org/pdb), or in the MOL Molecular Database format.
The PDB/MOL Import Converter was designed to allow PDB/MOL users to bring their models into the Okino software, or to any other 3D rendering/authoring/VR/AR/modeling package. Once imported, the model data can be manipulated, renderings can be generated and the data can be re-exported to various other 3D formats.
NOTE: This converter expects that the first line of a .PDB file begin with the keyword HEADER. If this keyword is not present then no data will be imported (otherwise, the import converter assumes the file is in the .mol file format).
Okino's NuGraf and PolyTrans software packages were heavily modified and optimized in order to import and render PDB files with thousands of atoms. However, getting this same number of polygonalized atoms into animation systems such as 3ds Max, CINEMA 4D, Maya and Lightwave is another story. In example test conversions they will basically grind to a halt at some point between importing the data, interactively viewing it or rendering the atoms.
The following conversion pipeline has been written and optimized for the conversion of PDB files to these respective programs:
- Set the "Atom/Bond Detail Level" to "Medium (s=6x6, c=4)". This sets the number of polygons that will be used to create the polygonalized spheres and cylinders. These values produce acceptable looking spheres/cylinders without too much chunkiness.
- After the PDB file has been imported into the stand-alone PolyTrans software go and execute the "Optimize number of objects & folders" from the "Win" menu of the upper-right "Selector Window". This is the black magic unique to Okino software which will merge objects together based on their grouping folders, and thus can greatly reduce the number of objects in the scene. If you want to merge all atoms into a single object then use the "Move selected objects to new object" menu item command instead.
- You can repeat the last step one or more times. Each time it will reduce the number of objects in the scene assuming that there still remains yellow grouping folders with children mesh objects in the scene hierarchy.
- If you wish, but is not totally necessary, you could apply Okino's polygon reduction system to the final scene.
- At this stage you would export to the destination file format. For 3ds Max and Maya, do a "Save as Okino .bdf" format and then load the .bdf file into 3ds Max using the Okino PolyTrans-for-3dsMax native conversion system and into Maya using the Okino PolyTrans-for-Maya native conversion system.
Note: Okino's PolyTrans-for-3dsMax and PolyTrans-for-Maya native plug-in conversion systems for 3ds Max and Maya were specifically written and optimized to import PDB files directly. If you choose to import the PDB files directly into MAX or Maya, and not use the aforementioned process, then the sphere and cylinder primitives used to recreate the PDB database will be mapped over to equivalent geometric primitives within 3ds Max and Maya. In other words, rather than importing a large polygonal database, the PDB files will rather use simpler sphere and cylinder geometric primitives. The only downside to using this method is that the overall number of objects will not have been compressed using the unique Okino "Optimize number of objects & folders" compression algorithm.
Due to the large number of spheres and cylinders that often are used to represent the contents of a PDB file the imported file may be slow to render or to display interactively. There are several approaches to speed up the redraw and rendering processes:
- Refer to the "Atom/Bond Detail Level" parameter below. You simply have to select a default setting from this combo list lower down in its list. The PDB importer creates parametric spheres and cylinders which can have their subdivisions changed on the fly (ie: the number of polygons) inside the stand-alone Okino PolyTrans or NuGraf software.
- If you wish to use a global solution to reducing the overall complexity of the imported data then the Okino polygon reduction system is the solution.
First, import the data into the stand-alone PolyTrans or NuGraf software. Left click on the "world" folder in the Selector Window. From the Geometry (NuGraf) or Edit (PolyTrans) menu select the "Polygon Reduction/Apply to All Objects in the Scene". Press the Reset button on the polygon reduction options dialog box, select the desired amount of reduction (80% is the default) and then press the "Start" button. This will first convert all the parametric spheres and cylinders into a polygon representation then the polygon reduction algorithm will reduce the total count of polygons by the desired amount.
Also the "Number of Subdivision Polygons" in the Ribbon Creation Options section controls how many polygons are used to represent the ribbons. Setting this number lower will create fewer polygons.
The main WEB reference for PDB files is http://www.rcsb.org/pdb. For a quick example of accessing PDB, use a WEB browser to visit the http://www.rcsb.org/pdb home page and enter the keyword '1b25' into the 'Search: Enter a PDB ID' type-in box shown on this main WEB page. This will access a 1.8MB PDB database file. On the next WEB page which is shown press 'View Structure' to view the structure of the protein, or press 'Download/Display File' to download the protein database file to your computer. Once downloaded, you can use this PDB import converter to convert the file into other file formats, or to render it.
The Protein Databank (PDB) is an archive of experimentally determined three-dimensional structures of biological macromolecules, serving a global community of researchers, educators, and students. The archives contain atomic coordinates, bibliographic citations, primary and secondary structure information, as well as crystallographic structure factors and NMR experimental data.
The Protein Data Bank (PDB) is the single international repository for public data on the 3-dimensional structures of biological macromolecules. The contents are primarily experimental data derived from X-ray crystallography and NMR experiments. The primary goals of this resource are:
- To enable you to locate structures of interest;
- To perform simple analyses on one or more structures;
- To act as a portal to additional information available on the Internet;
- To enable you to download information on a structure, notably the Cartesian atomic coordinates, for further analysis.
The database is constantly updated as new structures are deposited by the international scientific community. As described on a PDB database WEB page, most of the three-dimensional macromolecular structure data in the Protein Data Bank were obtained by one of three methods: X-ray crystallography (over 80%), solution nuclear magnetic resonance (NMR) (about 16%) or theoretical modeling (2%).
The PDB file format is a text-based file format that is designed to convey information about the structure of molecules; namely organic compounds such as proteins. This information consists of atomic co-ordinates, element composition, chain and grouping characteristics and bonding information. More information about this file format can be found at http://www.rcsb.org/pdb.
PDB molecules (termed models) are divided into the standard (ATOM) and non- standard (HETATM) sections. The standard sections consist of one or more chains. These chains themselves contain one or more groups of atoms. Each group is either one of 20 amino acids or 5 nucleosides. The non-standard sections contain single atoms that are not part of a chain and/or form their own structures.
Each atom, regardless of whether it is standard or non-standard, contains its own line in the PDB file. This line contains the (x,y,z) co-ordinate, element, parent chain (if any), parent group and type (if any) and its unique serial number.
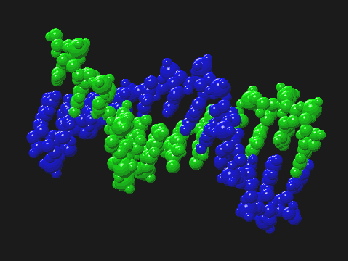
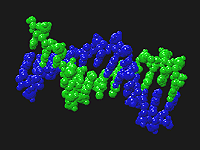
Chain, space-filled rendering of a PDB DNA molecule.
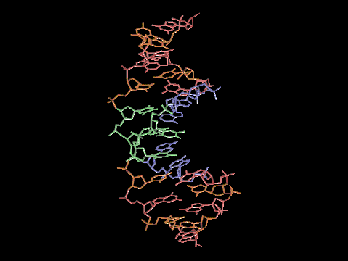
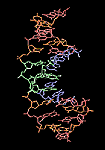
Amino group, bond only rendering of a PDB protein molecule.
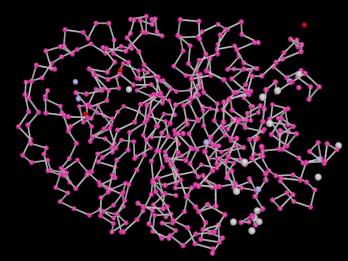
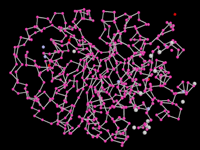
Backbone rendering of a PDB protein molecule.
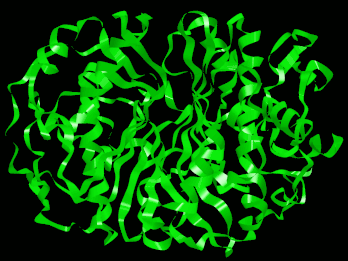
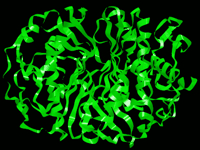
Same file as previous, ribbon rendering.
Atoms are bonded to each other in one of two ways: either implicitly or explicitly. Explicit bonds are found in CONECT entries where the serial numbers of the two bonding atoms are given. Implicit bonds occur between standard atoms in the same group. Pair-wise comparison of these atoms occurs and based on their separation (and the elemental types of the two atoms in question) a bond may or may not form. Adjacent groups in a chain may also bond in two ways: through a Polypeptide (C-N) bond or a Sugar Phosphate (O-P) bond. Additionally, chains (or non-adjacent groups) may be connected through Disulphide Bridge (S-S) bonds. Such bonds only occur when the Sulphur atoms are contained within Cystine (CYS) amino acid groups.
ATOM entries are grouped in a number of ways. First, they are grouped by chains. Each chain represents a part of the molecule and the backbone of each chain is a separated entry from the other chains (if you look closely at a pdb file with more then one chain in backbone or ribbon view (ie: 1hho.pdb) you'll see that there are actually separated groups). Within a chain there are a number of residues (usually on the order of 10 - 100); each residue represents a group of atoms with one Alpha Carbon (labelled CA) in it. It is the alpha carbons in each residue and the Carbonyl Oxygen in each residue that this importer will use to produce the backbone and the ribbon.
ATOM - CHAIN (column 22 in the .pdb file) - RESIDUE (column 18 - 20 in the .pdb file)The backbone is formed by creating a list of the alpha carbons (and their coordinates) and then connecting them together with a visual representation.
MOL is a more general format, designed to convey all types of molecules. It was designed and maintained by MDL Inc. The format contains similar information to that of a PDB file, but it lacks chain and group information, since that does not apply to a general molecule.
RCSB Databank (sample PDB files). Start here for everything related to PDB:
http://www.rcsb.org/pdbHetero-compound Information Centre - PDB/MOL Source Files
http://xray.bmc.uu.se/hicup
- Properly interpret chains, groups and their interconnecting bonds, i.e.
Sugar Phosphates, Polypeptide Chains and Disulphide Bridges
- Organize atoms into folders based on their group and chain ids.
- Display a Ball & Stick representation of the molecule with the ability to
show/hide bonds and atoms, scale atoms based on their relative sizes and
color the bonds based on the elements they bond.
- Display an increased volume, Space Filled, representation where bonds are
shown by atoms overlapping.
- Display the backbone structure of the molecule with the ability to show/hide atoms, and scale atoms based on their relative sizes.
- Display a ribbon representation of the molecule with the ability to view the molecule in ribbon or strand view, show/hide the spline guides which created the ribbon, smooth the vertex normals (blend the individual polygons into a smooth ribbon), and alter the spline tension, strand thickness and number of subdivision polygons.
- Set the coloring scheme for an atom based on its element, its parent model,
its parent chain or its group type.
- Change the detail level of the output spheres and cylinders to improve
speed.
- Display import statistics and PDB/MOL file header information.
- Auto sensing between PDB and MOL formats.
These are the limitations of the converter (as it compares to RasMOL). In all cases, the omitted functionality is required in an analytical tool, not a rendering one.
- No support for coloring by structure or temperature (as in RasMOL).
- No wireframe rendering (as in RasMOL).
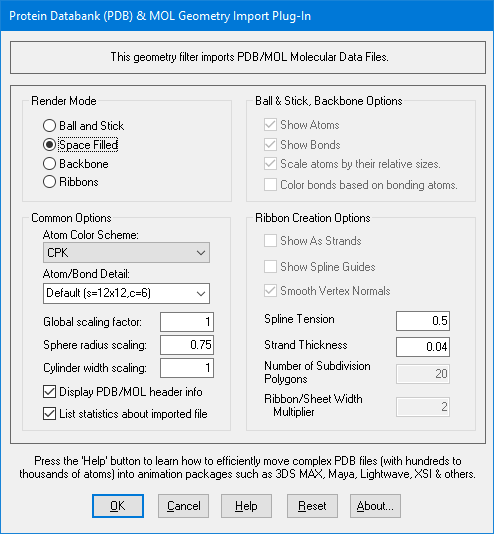
Ball and Stick
Selecting this option enables the ball and stick (sphere and cylinder) representation of the atoms and bonds, respectively. This also enables the following four options:Show Atoms
Checking/unchecking this box will enable/disable output of spheres for atoms.Show Bonds
Checking/unchecking this box will enable/disable output of cylinders for bonds.Scale atoms by their relative sizes
Checking this option will cause spheres representing atoms, to scale themselves based on the element of the atom being selected. The radii of the spheres are determined based on the atoms actual atomic radius. Unchecking this box causes all spheres to be output at the same radius.Color bonds based on their bonding atoms
Checking this box causes bonds to be split in two and each half colored based on the elements of the two atoms that it is bonding. Unchecking this box causes the bonds to be colored a default color. Note: this option has no effect unless Atom Color Scheme is set to CPK.Space Filled
This option will output atoms using their van der Waals radii and cause atoms that are bonded to have overlapping sphere volumes. No objects are output to explicitly convey bonds. This option also disables the previous four options.Backbone
Selecting this option enables the backbone representation of the protein (shows the protein's alpha carbons). This also enables the following two options.
Show Atoms
Checking/unchecking this box will enable/disable output of spheres for atoms.Scale atoms by their relative sizes
Checking this option will cause spheres representing atoms, to scale themselves based on the element of the atom being selected. The radii of the spheres are determined based on the atoms actual atomic radius. Unchecking this box causes all spheres to be output at the same radius.Ribbons
Selecting this option enables the ribbon representation of the protein (shows the ribbon interpretation of the protein's alpha carbons).This also enables the following six options.
Show As Strands
Checking this box will display the protein represented by the strands of the ribbons, leaving this box unchecked will display the protein represented by a solid ribbon.NOTE: Choosing the option Show As Strands is very labour intensive for the program since it uses large numbers of small cylinders to approximate the strands, this can significantly slow up the program. If you set the Number of Subdivision Polygons to a smaller number it will reduce the number of cylinders that are needed to produce the strands and greatly speed up the importer.
Show Spline Guides
Checking/unchecking this box will enable/disable output of the spline guides that were used to construct the ribbon. These are real 3D spline curves that can only be viewed within the stand-alone Okino PolyTrans/NuGraf software.Smooth Vertex Normals (Only available if Shows As Strands is unchecked)
Checking this option will smooth the individual polygons making up the ribbon so that the ribbon looks more like one smooth object, this is especially noticeable in the areas of changing light. Unchecking this box will leave the individual polygons which make up the ribbon more easily distinguishable.Spline Tension
The spline tension is a decimal number between 0.0 and 1.0 which sets the "roundness" of the spline curve which is used to construct the ribbon. The closer the tension is to 1.0 the rounder the spline curve will be. While all values from 0.0 to 1.0 are possible, values between 0.7 and 1.0 tend to produce the most pleasing results.Strand Thickness (Only available if Shows As Strands is checked)
The strand thickness is a decimal number between 0.0 and 1.0 which sets the thickness of the strands. While all values from 0.0 to 1.0 are possible, those between 0.02 and 0.25 produce the best results.Number of Subdivision Polygons
The number of subdivision polygons sets the number of polygons to use to approximate the ribbon between two points on the spline curve. Each point on the spline curve corresponds to an alpha carbon, thus if you have 20 alpha carbons and set the number of subdivision polygons to 10, the importer will draw the ribbon using 20 * 10 = 200 polygons. The larger you set the number of subdivision polygons to the smoother the ribbon will become. While any positive integer is possible, values between 5 and 15 produce the best effects with those closer to 15 producing smoother helixes and turns.NOTE: Choosing the option Show As Strands is very labour intensive for the program since it uses large numbers of small cylinders to approximate the strands, this can significantly slow up the program. If you set the Number of Subdivision Polygons to a smaller number it will reduce the number of cylinders that are needed to produce the strands and greatly speed up the importer.
Helix/Sheet Width Multiplier
The Helix/Sheet Width Multiplier is a decimal number from 0.0 to as large as you would like. The width of helixes and sheets are multiplied by this number. For example, entering a number of 2.0 will double the width of the helixes and sheets as compared to the rest of the ribbon. While values as large as you like are possible, those between 1.0 and 2.5 produce the best results. This is useful for accentuating helix and sheet structures by making them wider, or for getting rid of excess width that is blocking the ribbon by making them thinner.Atom Color Scheme:
This pull-down allows selection of one of five options that govern how atoms are colored when the PDB data is loaded.
- CPK (Corey, Pauling, Kultun): this scheme colors atoms based on their elemental type. Bonds all default to a grey color.
- Model: this scheme sets each model in the PDB file with a different color. Bonds are colored as the atoms.
- Chain: this scheme colors each atoms and bond within a chain the same color. This option acts like Monochrome for MOL files.
- Monochrome: this scheme colors everything the same color.
- Amino/Shapely: this scheme colors atoms and bonds based on the type of amino/nucleoside group. This option acts like Monochrome for MOL files.
Atom/Bond Detail Level
This pull-down gives a list of sphere/cylinder detail options that can speed up (lowest setting) or make smoother (highest setting) the spheres and cylinders drawn to the screen or when they are re-exported to another file format.For example, "Default (s=12x12, c=6)" sets the internal geometric subdivisions for spheres to 12x12 and the subdivisions for cylinders to 6. Selecting higher numbers will create smoother spheres and cylinders. After the import process has completed you can fine tune the subdivisions by selecting the " Edit/Preferences/Global Geometric Subdivisions…" menu item and then changing the Cylinder and Sphere subdivision parameters. Because the PDB importer creates parametric cylinders and spheres (a polygon representation is created on the fly during display time only), they will be re-generated on the fly with the new subdivisions when such parameters are changed; only during export or during polygon reduction do the parametric cylinders and spheres get converted to a polygonal representation.
Global Scaling Factor
Supplying a number here other than 1 will scale the PDB/MOL data by the given amount.Display PDB/MOL header information
Displays the information contained in the HEADER and COMPND entries in the PDB file. For MOL files, information contained in the title (first) and comment (third) lines are displayed.List statistics after importing PDB/MOL file
Displays the number of atoms (and hetatoms), the number of models and the number of bonds that are contained in the file.


